Challenge
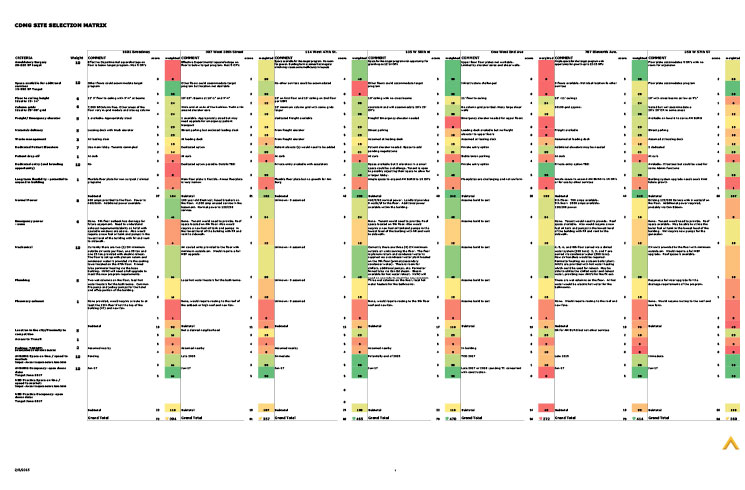
With a client wanting to rapidly assess potential sites for expansion, large amounts of assessment data needs to be broken down into comparable data sets so no detail is left unanalyzed.
Solution
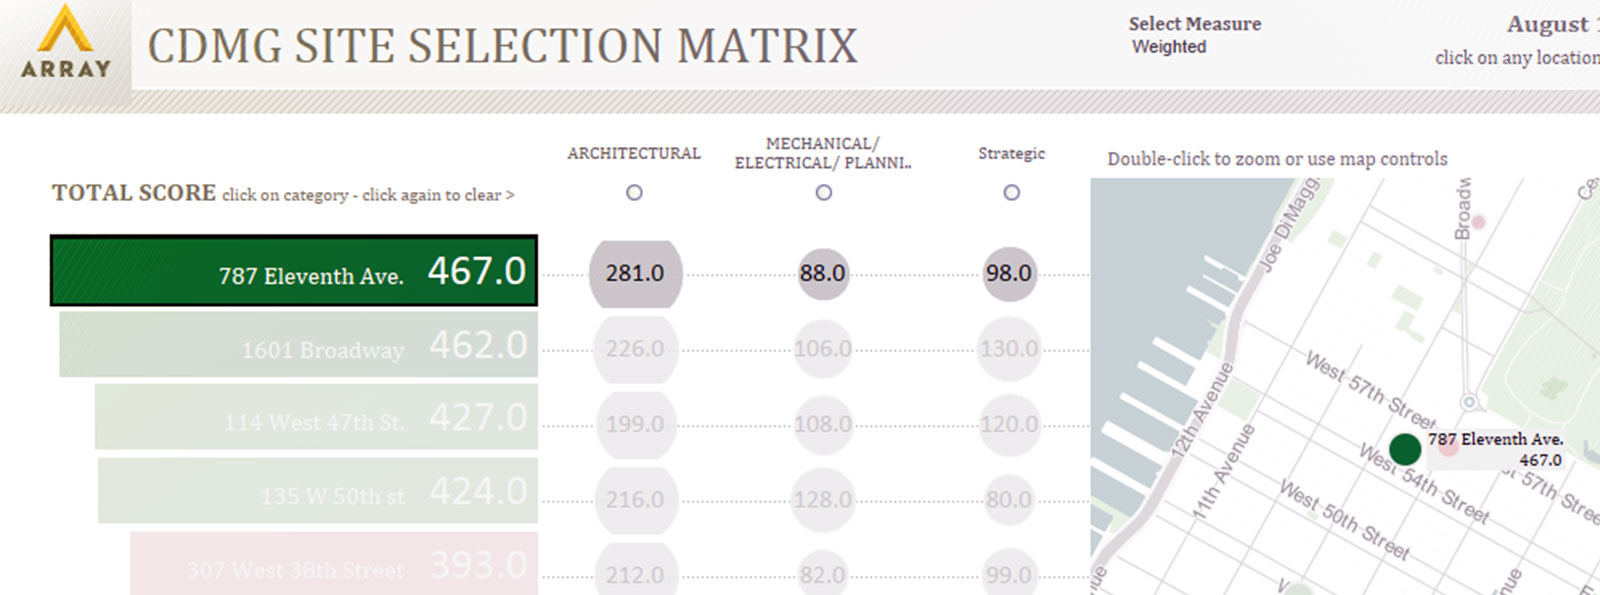
Employing a data visualization tool distills the collected data in a manner that can result in more clarity for owners, developers and real estate agents.
Result
A Site Selection Matrix catalogues the data entered for each site for easy comparison. Rather than scrolling through dense spreadsheets, the viewer can highlight a site by clicking on its address and see its data, such as overall rating, individual item group ratings, comments, criterion and criterion weight, or any other associated data while simultaneously seeing how that data compares to other locations.


